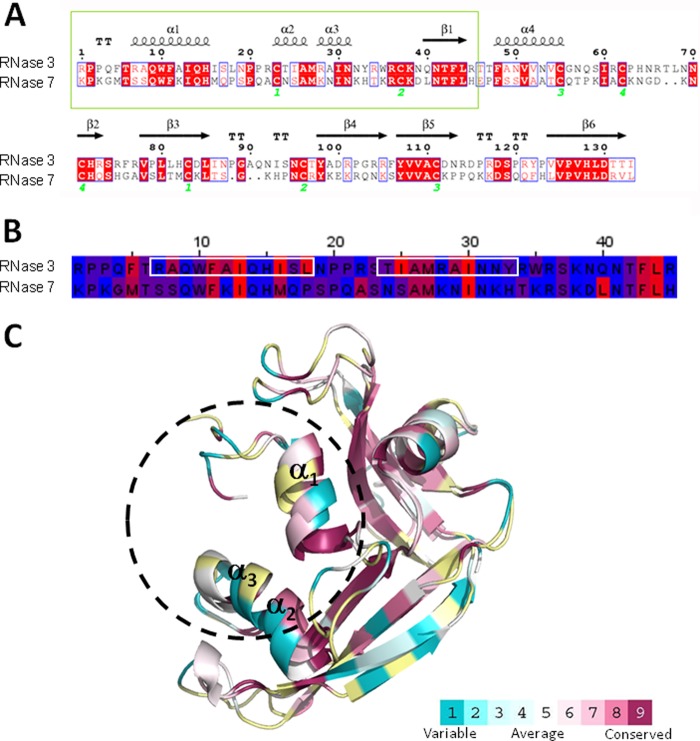
Fig 1.
(A) Comparison of the blast alignment of RNase 3 and RNase 7 primary sequences. The secondary structure of RNase 3 is depicted (4A2O PDB [76]). Strictly conserved residues are boxed in red, and conserved residues, as calculated by a similarity score, are boxed in white. The first 45 residues corresponding to RNase 3 and RNase 7 peptides are in a green box. Cysteine pairings for disulfide bridges are numbered below. The figure was created using the ESPript software (77). (B) Sequence alignment of RN3(1-45) and RN7(1-45) peptides. Residues are colored according to their hydrophobicity using the sequence alignment editor Jalview (78), and the aggregation prone regions predicted by both Aggregscan (79) and WALTZ (80) are boxed in white. (C) Graphic representation of RNase 3 and RNase 7 three-dimensional structures. The coordinates were obtained from 4A2O PDB (76) and 2HKY PDB (81), respectively. The surface representation was colored using the CONSURF web server (http://consurf.tau.ac.il/), featuring the relationships among the evolutionary conservation of amino acid positions inside the RNase A family. Residues were colored by their conservation score using the color-coding bar at the bottom image. Residues were colored in yellow when not enough information was available.

