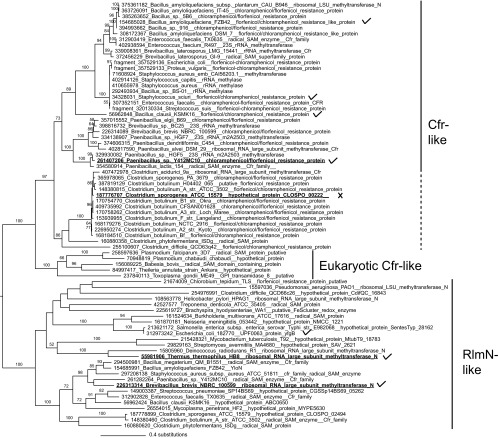
Fig 2.
Maximum likelihood phylogenetic tree of a subset of Cfr- and RlmN-like sequences. Maximum likelihood bootstrap percentage (MLBP) support is indicated on branches. Only branches with >50% MLBP support are labeled. The scale bar below the tree shows the evolutionary distance, expressed as the number of substitutions per site. Numbers in taxon names are NCBI GI numbers. Underlined genes are investigated in this study. A check mark indicates a function/modification as predicted, and X indicates a function that was tested and not verified.

