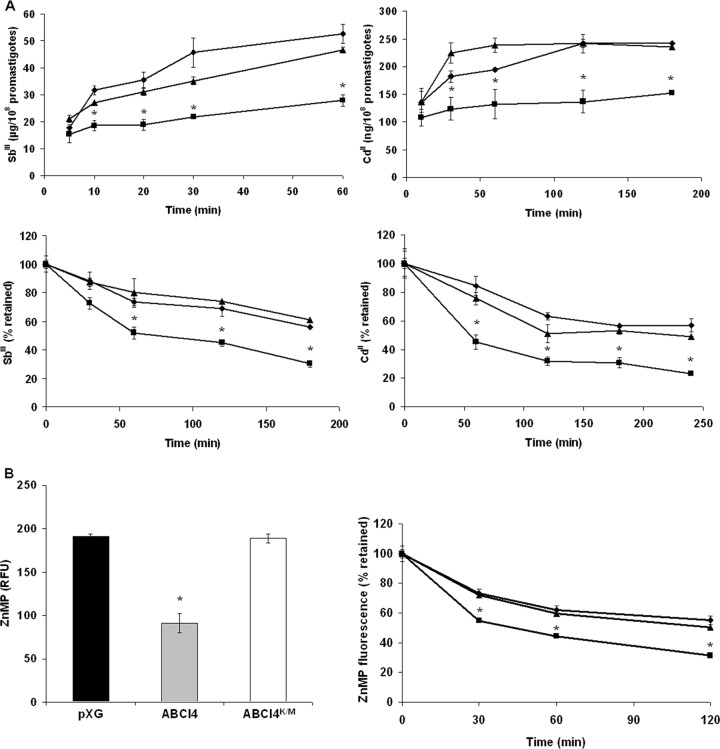
Fig 2.
Time-dependent accumulation and efflux of Sb(III), Cd(II), and ZnMP in Leishmania lines. (A) L. major pXG (control; ◆), overexpressing ABCI4 (■) and ABCI4K/M (▲) were incubated with 100 μM Sb(III) (upper left graphic) or Cd(II) (upper right graphic), and samples were taken at different time points as described in Materials and Methods. Antimony accumulation was measured by ICP-MS. For Cd(II) accumulation, samples were taken at different time points, mixed with Leadmium Green, and the fluorescence determined (upper right graphic) as described in Materials and Methods. The efflux assay was performed after incubation of Leishmania lines with compensated concentrations of Sb(III) (lower left graphic) or Cd(II) (lower right graphic) for 1 h to ensure similar labeling in the different lines. The parasites were then washed and resuspended in PBS buffer without Sb(III) or Cd(II) and pelleted at different time points. (B) Promastigotes of L. major lines pXG (control; black histogram), ABCI4 (gray histogram), and ABCI4K/M (white histogram) were incubated with 10 μM ZnMP for 10 min at 28°C, as described in Materials and Methods (left graphic). Relative fluorescence units (RFU). The efflux assay was performed in L. major lines loaded with different compensated ZnMP concentrations in order to ensure similar labeling, as described in Materials and Methods (right graphic). In both graphics, the accumulated fluorescence at different time points was measured by flow cytometry using a FacsAria Cell Sorter III. The data are the means ± the SD of three independent experiments. Significant differences versus the control line were determined by using the Student t test (*, P < 0.01).

