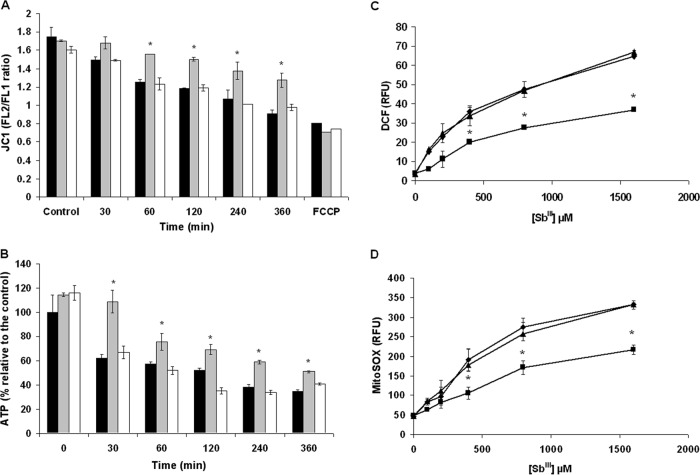
Fig 4.
Changes of ΔΨm, ATP, and ROS generation in Leishmania lines exposed to Sb(III). L. major lines pXG (control; black histograms), ABCI4 (gray histograms), and ABCI4K/M (white histograms) were preincubated with 100 μM Sb(III) for different times (30, 60, 120, 240, and 360 min) and then incubated with 5 μM JC1 for 10 min for ΔΨm determination (A) or mixed with the same volume of CellTiter-Glo (Promega) for ATP measurement (B), as described in Materials and Methods. The FL2/FL1 fluorescence ratio was measured by flow cytometric analysis. Parasites were pretreated with 10 μM FCCP for depolarization control. Intracellular ROS levels were measured using the fluorescent probes H2DCFDA (C) and MitoSOX Red (D). L. major lines pXG (controls; ◆) and overexpressing ABCI4 (■) and ABCI4K/M (▲) were incubated with different concentrations of Sb(III), as described in Materials and Methods. (C) After Sb(III) treatment, parasites were incubated with 40 nM H2DCFDA for 30 min at 28°C. (D) Prior to the addition of Sb(III), parasites were incubated with 5 μM MitoSOX for 2 h at 28°C. The fluorescence intensity was determined by flow cytometric analysis and expressed as relative fluorescence units (RFU). The data are the means ± the SD of at least three independent experiments. Significant differences versus the control line were determined by using the Student t test (*, P < 0.01).

