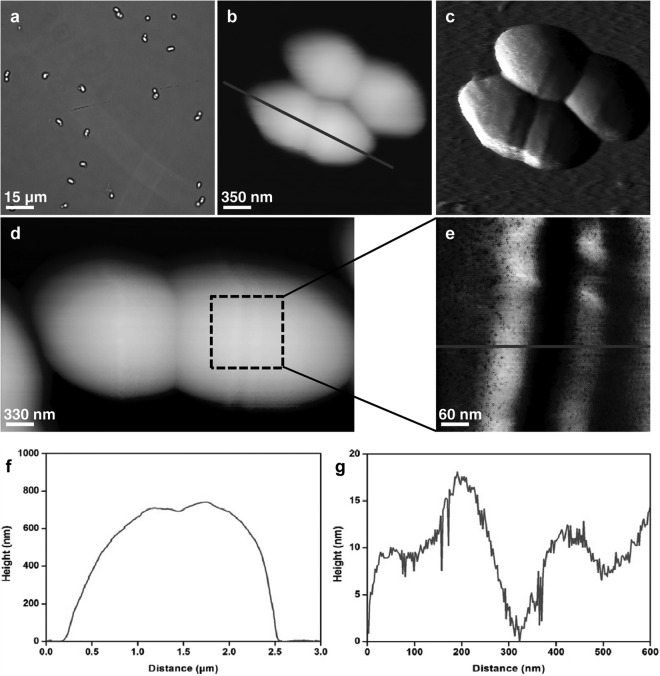
Fig 2.
Images of S. cerevisiae (strain BY4741) cells treated with caspofungin at 4× MIC (0.5 μg/ml). (a) Optical image of living cells immobilized on a PEI-coated glass slide. (b) AFM height image (z range = 1.2 μm) of two cells. (c) Vertical-deflection image corresponding to the height image in panel b. (d) AFM height image of a single cell (z range = 1.2 μm). (e) Height image of the boxed area in panel d (z range = 20 nm). (f and g) Cross-sections taken along the lines in panels b (f) and e (g).

