
Fig 6.
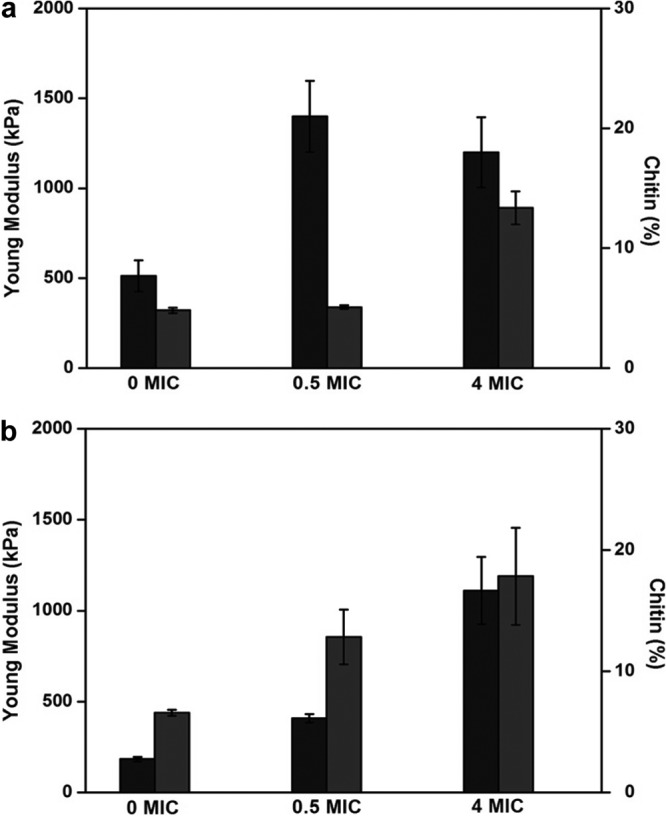
Quantitative analysis of chitin compositions of the yeast cell wall, correlated with Young modulus values. The histograms show Young modulus values (black bars) and chitin (gray bars) for S. cerevisiae (strain BY4741) (a) and for C. albicans (b) under different caspofungin conditions. The analyses for Young modulus values were performed on five cells from 3 independent cultures.