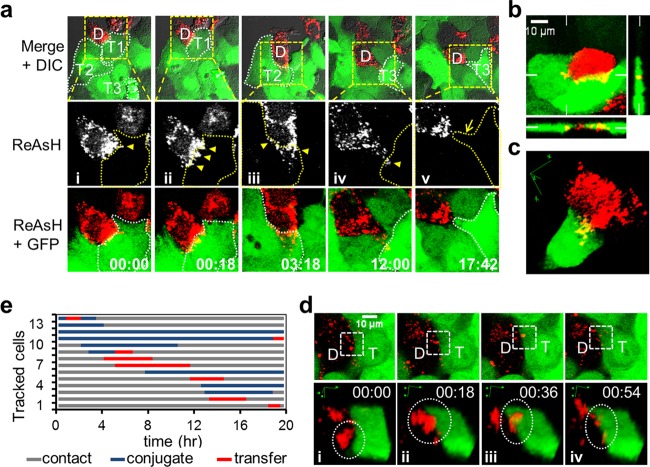
Fig 9.
Live-cell imaging of CCCM HCV transfer. JFH1-TCcore-infected ReAsH-labeled Huh7.5.1 donor cells (red) and Huh7.5.1-GFP target cells (green) were cocultured and imaged live for 18 h. (a) CCCM HCV transfer from one ReAsH-positive TCcore-positive donor cell (labeled D) to three GFP-positive target cells (labeled T1, T2, and T3 and outlined) sequentially over 18 h of coculturing. The ReAsH, GFP, and DIC overlay is shown in the upper panels, from which the boxed area was magnified and examined in the middle (ReAsH only) and the lower (ReAsH and GFP overlay) panels. HCV transfer from the donor cell (D) to target cells T1 (i and ii) and T2 (iii), and T3 (vi) is indicated by yellow arrowheads. The yellow arrow (v) indicates T3's filopodia toward D after viral transfer. Times are shown in hours:minutes. (b) Concurrent HCV transfer from one donor cell (red) to two target cells (green). Orthogonal views are shown, and the positions of the perpendicular planes are indicated as notches. (c) 3D reconstruction of a transfer event between a donor cell and one target cell observed in panel b. This transfer event occurred at a time later than that shown in panel b. (d) Transfer of a viral punctum (circled in the lower panels) into a target cell: (i) donor cell-target cell in contact before conjugate formation; (ii) formation of viral puncta-target cell conjugation; (iii) transfer of viral puncta; and (iv) posttransfer. The lower panels are 3D reconstructions of the boxed area in the corresponding upper panels. (e) Tracking of transfer events in 13 donor cells in one imaging field; each line represents one donor cell-target cell pair.

