
Fig 2.
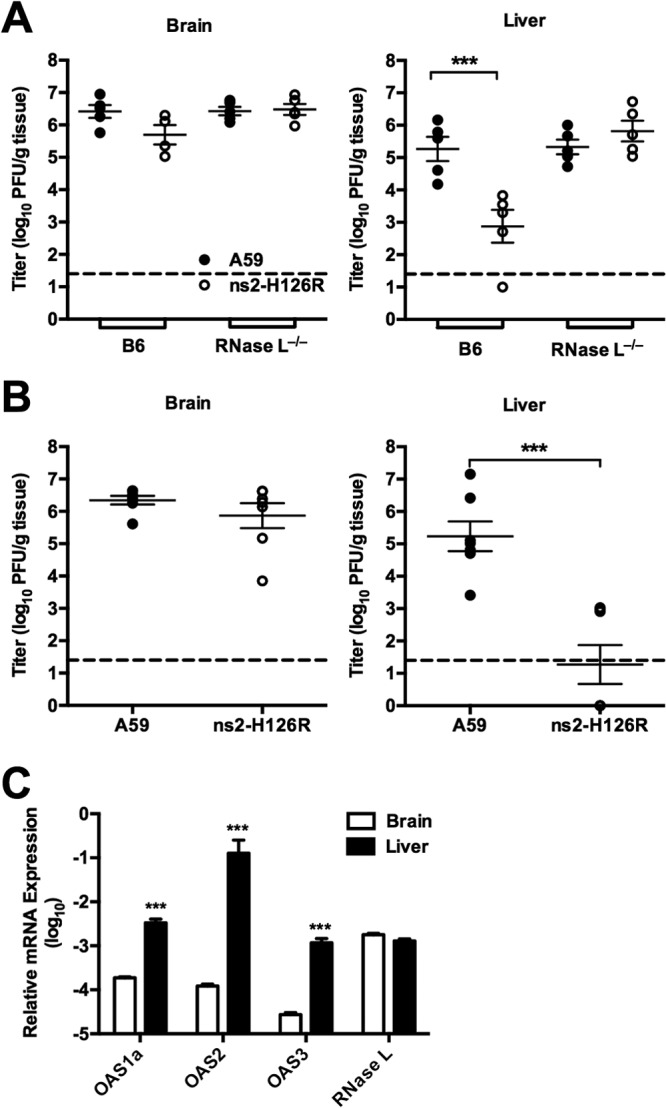
Replication of A59 and ns2-H126R in the liver and the brain in B6 and RNase L−/− mice. (A) B6 and RNase L−/− mice were inoculated intracranially with 200 PFU/mouse of A59 or ns2-H126R (n = 5). The mice were sacrificed at 5 days p.i., the brains and livers were harvested, and the virus titers were determined by plaque assay. (B) B6 and RNase L−/− mice were inoculated intranasally with 2 × 10⁵ PFU/mouse of A59 or ns2-H126R (n = 5). The mice were sacrificed at 5 days p.i., the brains and livers were harvested, and the virus titers were determined by plaque assay. Dashed lines designate the lower limit of detection. (C) RNA was extracted from the livers and brains of uninfected mice (n = 5); expression levels of OAS1a, OAS2, OAS3, and RNase L mRNAs were assessed by qRT-PCR. mRNA expression levels relative to that of β-actin mRNA were expressed as 2−ΔCT [ΔCT = CT(gene of interest) − CT(β-actin)]. The data are from one representative of two experiments performed and are shown as the means ± standard errors of the mean (SEM). ***, P < 0.001.