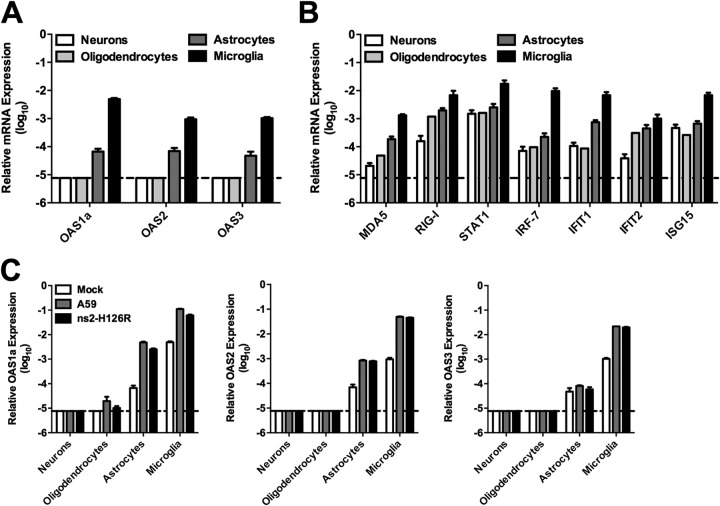
Fig 6.
OAS expression in primary neural cell cultures. (A) RNA was extracted from neurons, oligodendrocytes, astrocytes, and microglia, and OAS1a, OAS2, and OAS3 mRNA expression levels were quantified by qRT-PCR. (B) MDA5, RIG-I, STAT1, IRF-7, IFIT1, IFIT2, and ISG15 mRNA levels were quantified from the same RNAs as in panel A. (C) Primary cell cultures were infected with A59 or ns2-H126R or mock infected; at 24 h p.i., RNA was extracted and OAS1a mRNA was quantified. mRNA expression levels relative to β-actin mRNA were expressed as 2−ΔCT [ΔCT = CT(gene of interest) − CT(β-actin)]. The data are from one representative of two experiments performed in triplicate and are shown as means and SEM. Dashed lines designate the lower limit of detection.

