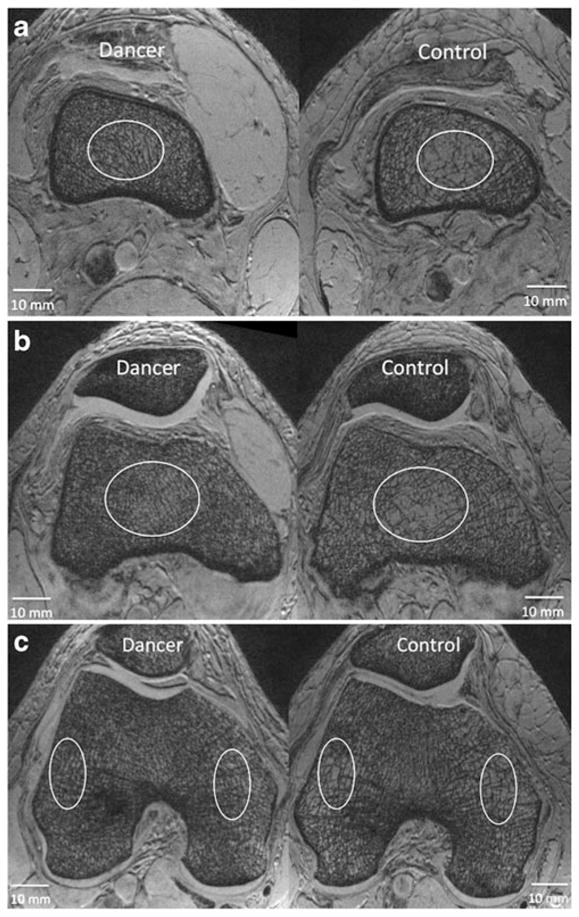
Fig. 2.

a Representative axial 7-T MR images from a dancer and a control at the level of the distal femoral diaphysis demonstrating differences in bone microarchitecture. In MR images of bone microarchitecture, trabeculae are represented by hypointense (dark) linear structures and marrow is hyperintense (white). More trabeculae are visualized in the dancer than in the control. Ovals are only placed to highlight areas with prominent differences; the entire cancellous bone compartment was analyzed to determine cancellous bone stiffness and cross-sectional area. b Representative axial 7-T MR images from a dancer and a control at the level of the distal femoral metaphysis demonstrating differences in bone microarhcitecture. In MR images of bone microarchitecture, trabeculae are represented by hypointense (dark) linear structures and marrow is hyperintense (white). More trabeculae are visualized in the dancer than in the control. Ovals are only placed to highlight areas with prominent differences; the entire cancellous bone compartment was analyzed to determine cancellous bone stiffness and cross-sectional area. c Representative axial 7-T MR images from a dancer and a control at the level of the distal femoral epiphysis demonstrating differences in bone microarhcitecture. In MR images of bone microarchitecture, trabeculae are represented by hypo-intense (dark) linear structures and marrow is hyperintense (white). More trabeculae are visualized in the dancer than in the control. Ovals are only placed to highlight areas with prominent differences; the entire cancellous bone compartment was analyzed to determine cancellous bone stiffness and cross-sectional area
