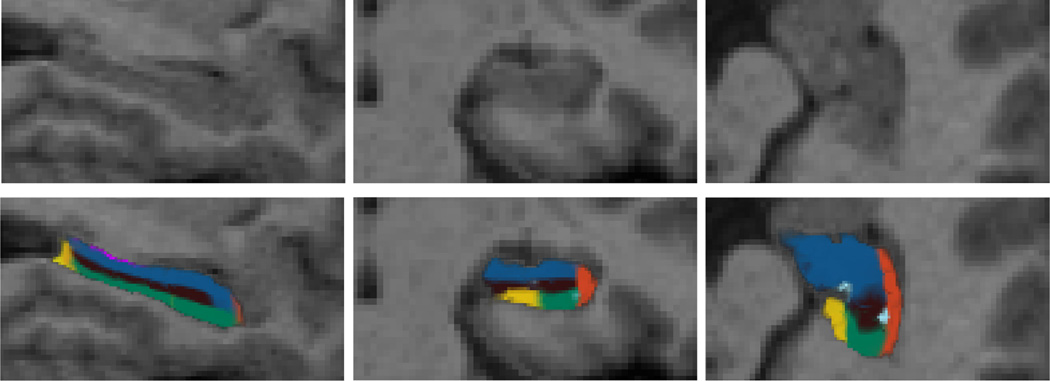
Figure 2.

Top row: sagittal, coronal and axial slice from the left hippocampus of a sample scan from the dataset. Bottom row: corresponding MAP segmentation produced by the baseline Bayesian algorithm, i.e., computed by optimizing Equation 8. The color map for the subfields is the same as in Figure 1.
