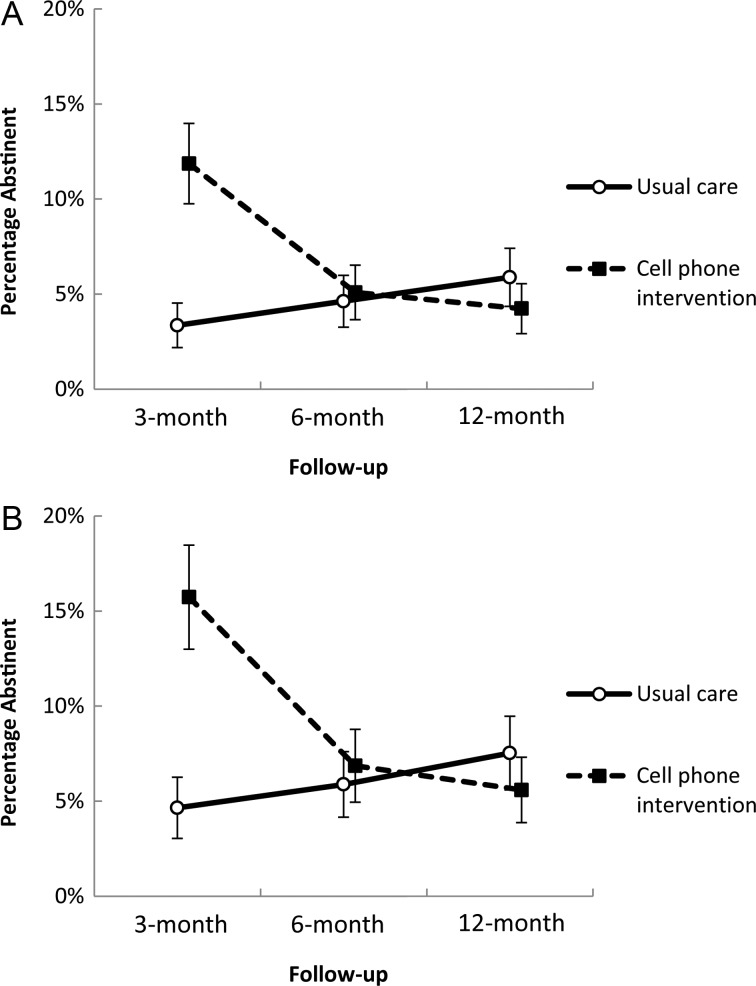
Figure 2.
Smoking abstinence by treatment group, showing the percentage of participants in each treatment condition (usual care vs cell phone intervention) who reported 7-day smoking abstinence at the 3-, 6-, and 12-month follow-up periods. Bars represent the standard error of the mean. A and B, Percentage abstinent using the intent-to-treat and complete-case approach, respectively.

