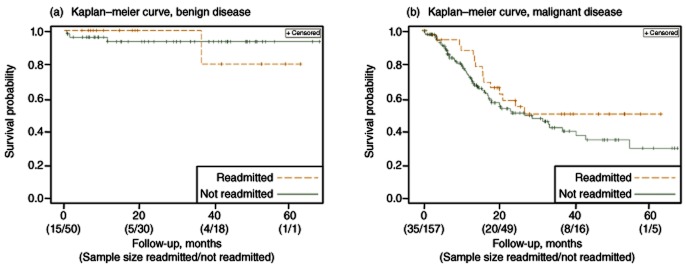
Figure 2.

Kaplan–Meier survival curves: (a) Patients with benign disease, show no difference in survival when stratified by 30-day readmission (Log-Rank Chi-Square = 0.02, P = 0.88); (b) patients with malignant disease, show no difference in survival when stratified by 30-day readmission (Log-Rank chi-square = 1.51, P = 0.22)
