
Figure 5.
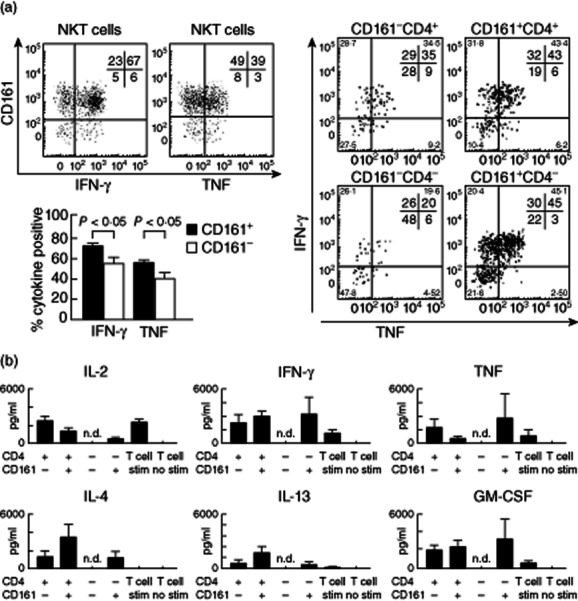
CD161 expression identifies functionally distinct natural killer T (NKT) cells within established subsets. Representative fluorescence activated cell sorter (FACS) plots show interferon (IFN)-γ and tumour necrosis factor (TNF) production by CD4+ and CD4− NKT cells from adult human blood after 4 h PMA/ionomycin stimulation. Graphs show the proportion of NKT cells that secrete IFN-γ and/or TNF after 4 h PMA/ionomycin stimulation (n = 18). Cytokine expression by sorted populations of CD4+CD161−, CD4+CD161+, CD4−CD161− and CD4−CD161+ (n = 4) NKT cell subsets are shown in right-hand representative plots. (b) Cytometric bead array (CBA) was used to quantify concentrations of six different cytokines in culture supernatants; n.d. indicates that insufficient numbers of CD4−CD161− cells were sorted to generate meaningful CBA data. Data are normalized to reflect cultures of 10 000 cells equivalent. Statistical analysis using Wilcoxon test.