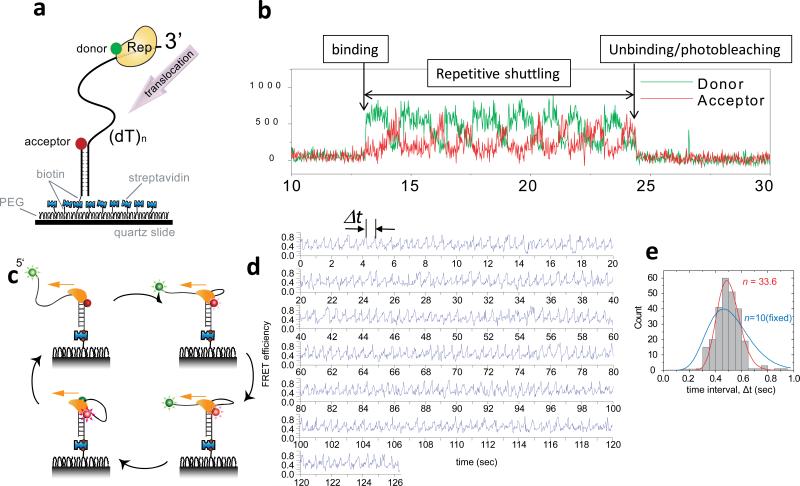
Figure 7. Repetitive ssDNA translocation of Rep and PcrA.
(a) A donor-labeled Rep monomer translocates on an acceptor-labeled DNA in the 3’ to 5’ direction. (b) Initial binding of Rep is detected as a sudden increase in fluorescence. This is followed by a gradual increase in the acceptor intensity (red) and a concomitant decrease in the donor intensity (green) due to Rep translocation on ssDNA. The protein then snaps back to the initial low FRET state and repeats the cycle until protein unbinding or photobleaching of the donor terminates the fluorescence signal. (c) A cartoon showing how a PcrA monomer can anchor itself to a ds/ssDNA junction and use its ssDNA translocation activity to reel in a 5’ ssDNA tail. Once it runs off the tail end it can re-initiate the repetitive looping cycle from the junction. (d) Representative smFRET time traces of repetitive ssDNA looping (256 cycles) induced by a single molecule of PcrA. Δt denotes the time interval of each cycle. (e) Δt histogram from a single PcrA molecule showing 256 cycles of looping. A fit to the Gamma distribution gives the number of hidden steps, n=33.6, for 40 nt ssDNA (red), supporting a single nt kinetic step size. A forced fit with a fixed n value of 10 to mimic a 4 nt kinetic step size gives a much poorer fit (blue). Figures were adapted from Refs (92; 100).

