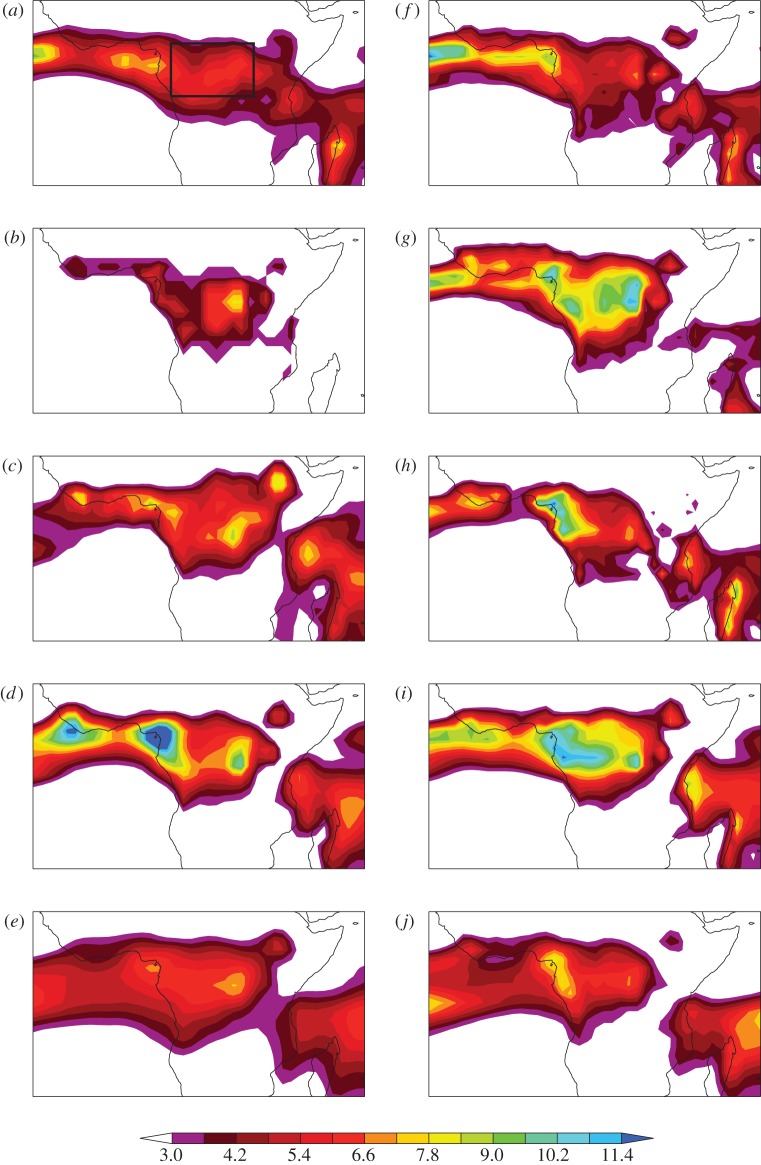
Figure 3.
Rainfall climatologies (mm d−1) during MAM for the following datasets: (a) CMAP, (b) TAMSAT, (c) NCEP, (d) ERA-40, (e) ensemble mean of CMIP3, (f) TRMM, (g) CMORPH, (h) CFSR, (i) ERA-Interim, (j) ensemble mean of CMIP5. Years as defined in text. Box in (a) plot corresponds to area average used to derive data in figures 1 and 2.

