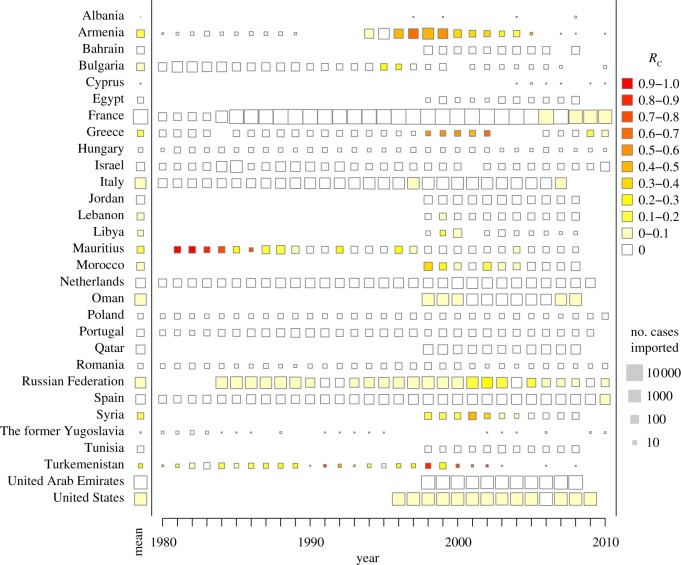
Figure 1.
For 30 countries where data were available, data on imported malaria and any locally acquired malaria case were analysed to estimate the reproductive numbers for malaria, RC, under post-elimination levels of control in each year. The results are shown as the colour of the square. The average for all years is shown on the left, by the name of the country. The size of the square scales with the logarithm of the number of cases imported.

