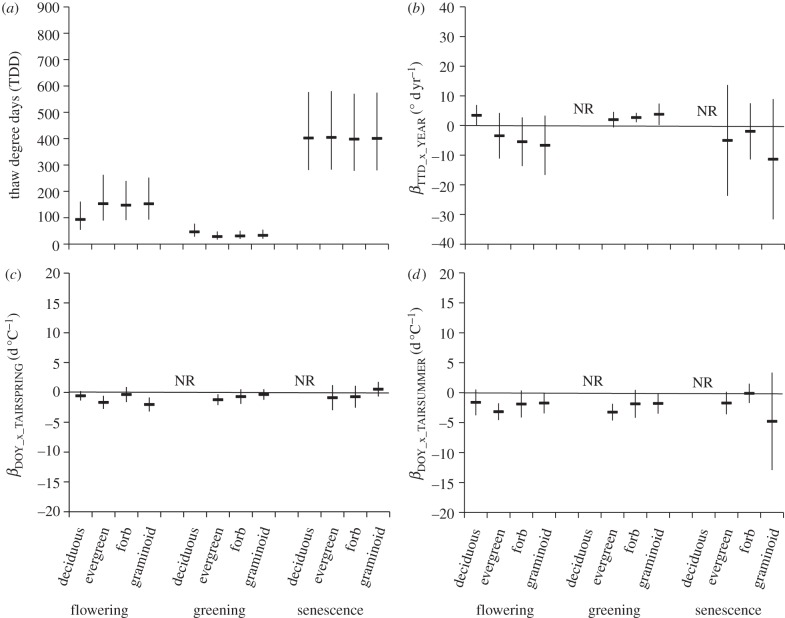
Figure 7.
Differences in phenological response among growth forms (deciduous shrub, evergreen shrub, forb and graminoid). (a) The least-squares mean TDD ± s.e. attained at each phenological event (flowering, greening and senescence) by growth form. The mean slope and 95% credible intervals of the relationship between: (b) TDDs at each phenophase and year (βTDD_x_YEAR); (c) DOY at each phenophase and mean spring (April–May) temperature (βDOY_x_TAIRSPRING); and (d) DOY at each phenophase and mean summer (June–August) temperature (βDOY_x_TAIRSUMMER) for each phenological event partitioned by growth form. NR, not reported–insufficient data.

