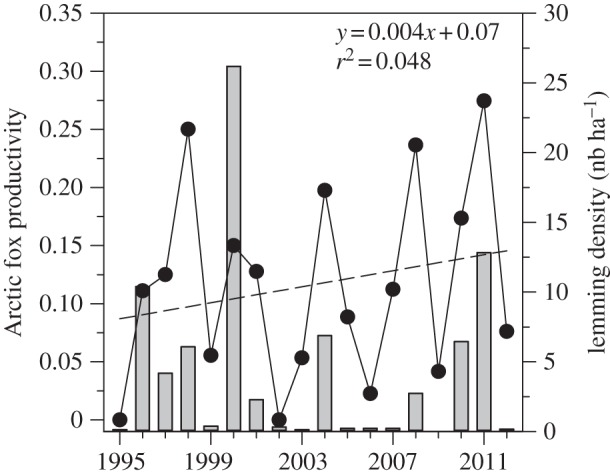
Figure 8.

Annual productivity of Arctic foxes (proportion of monitored dens with fox litter) on Bylot Island from 1995 to 2012. The regression line shows the temporal trend in productivity (1989 = year 0 in the regression equations). Grey bars show annual lemming density.
