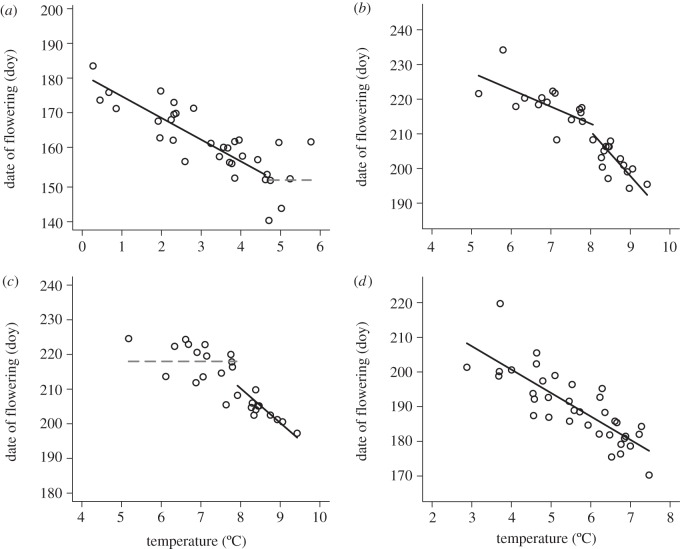
Figure 3.
Examples of types of nonlinear flowering responses to temperature using data from one species and one flowering response for each panel (a–d). The percentage of species showing each type of nonlinear flowering response is shown for Gothic in table 2. Nonlinear flowering responses to temperature were not supported at Zackenberg. Note that axes cover the same range but are not the same values. Solid black lines represent slopes that differ from zero, and slopes that do not differ from zero are shown as horizontal dashed grey lines. (a) Boechera stricta onset: R2 = 0.73, (b) Oreochrysum parryi onset: R2 = 0.83, (c) Pyrrocoma crocea peak: R2 = 0.78 and (d) Potentilla gracilis var. pulcherrima onset: R2 = 0.66.

