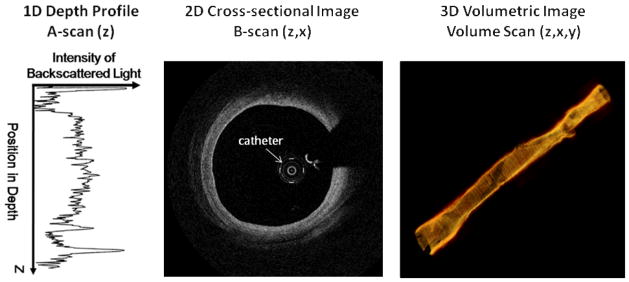
Figure 1. OCT scanning schemes.

The left panel shows a typical A-scan collected from a sample. The middle panel depicts a typical B-scan of a coronary vessel where the catheter has been rotated, thus scanning a cross-section of the vessel. The data is transformed into polar coordinates to accurately portray the circular structure of the vessel. The right panel illustrates volumetric imaging of a coronary vessel. To achieve 3-D imaging the catheter is pulled back as it is rotating tracing out a helical pattern.
