
Figure 3.
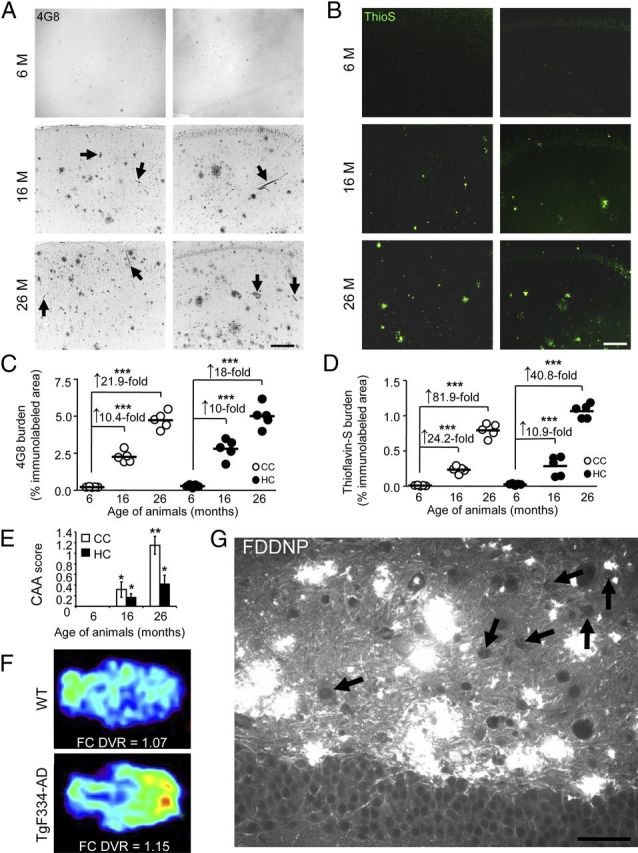
TgF344-AD rats manifest progressive Aβ deposition. A, B, Photomicrographs are shown from TgF344-AD rat brain sections with median values by image analysis for human Aβ immunohistochemistry. Two brain areas (CC and HC) and three age groups (6, 16, or 26 months) are shown for antibody 4G8 (A) and ThioS stain (B). Arrows in A indicate CAA. Photomicrographs taken of cortex or HC from transgenic animals (4 sections per animal, n = 5) were subjected to quantitative image analysis for 4G8 (C) or ThioS burden (D). Fold increases across age points are indicated for each brain region. Scale bars: A, B, 100 μm. E, Quantitative image analysis of ThioS-stained TgF334-AD rat brain sections was performed to assess CAA. Bars represent the mean CAA score ±SEM of each cohort (4 sections per animal, aged 6 months, n = 5; 16 months, n = 5; 26 months, n = 5). F, Representative MicroPET images are shown from 15-month-old WT and TgF344-AD rats using the amyloid radiotracer, 18F-FDDNP. Parametric color-coded transverse images are shown of distribution volume ratios (DVRs), with brainstem as the reference region. Frontal cortex (FC) is oriented toward the right and brainstem, toward the left. Colors run from blue (lowest DVR = 0.95) to red (highest DVR = 1.2). Similar results were obtained from 2 to 3 additional rats. G, A brain section from a 15-month-old TgF344-AD rat reacted with FDDNP shows abundant Aβ deposits in the dentate gyrus by fluorescence microscopy. Arrows indicate apparent intraneuronal hilar FDDNP-reactive deposits, and scale bar denotes 50 μm.