
Figure 7.
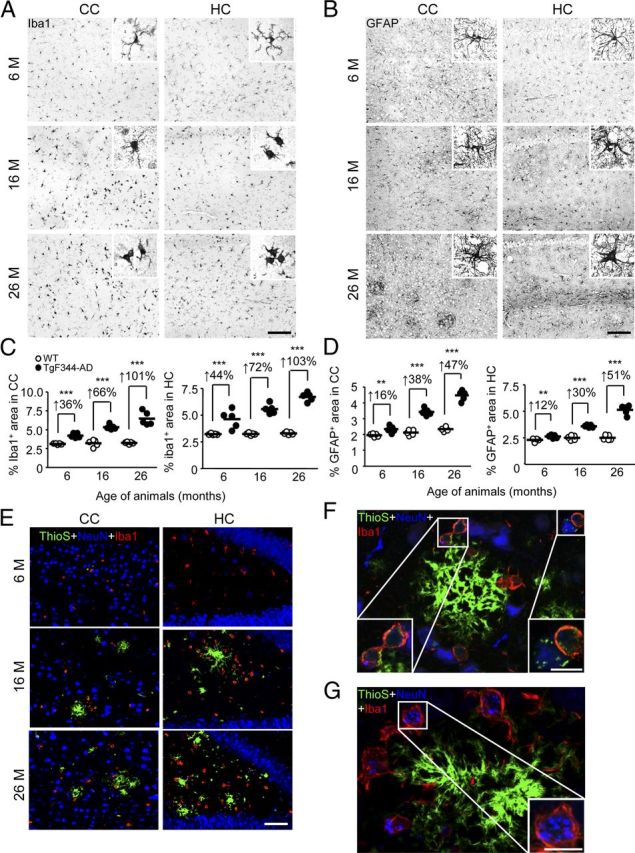
TgF344-AD rats have neuroinflammation and microglial uptake of neuronal debris. A–D, Photomicrographs are shown from TgF344-AD rat brain sections with median values by image analysis for gliosis IHC. Two brain regions (CC or HC) and three age groups (6, 16, or 26 months) are shown for Iba1 antibody (A) or GFAP antibody (B) staining. Photomicrographs taken of CC or HC from WT or TgF344-AD rats (4 sections per animal, n = 5) were subjected to quantitative image analysis for Iba1 (C) or GFAP burden (D). Percentage increases within ages are indicated for each brain region. Scale bars: A, B, 100 μm. E, Photomicrographs are shown of TgF344-AD rat brain sections stained with ThioS, NeuN antibody, and Iba1 antibody. Two brain regions (CC or HC) and three age groups (6, 16, or 26 months) are shown, and the scale bar denotes 50 μm. F, G, Photomicrographs of cortex from 26-month-old TgF344-AD rats stained with ThioS, NeuN antibody, and Iba1 antibody are depicted. Insets show amyloid-containing (F) or neuronal nuclei (NeuN; G) containing microglia, and scale bars denote 10 μm.