
Figure 9.
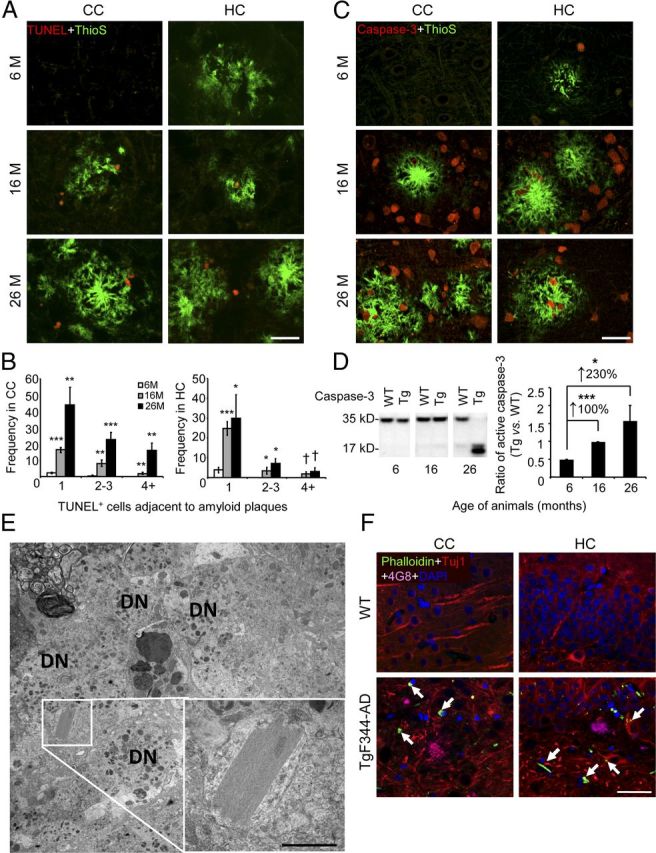
Evidence of apoptosis and neuronal distress in TgF344-AD rat brains. A, Photomicrographs are shown of TgF344-AD rat brain sections reacted with TdT-mediated TUNEL (red signal) and ThioS (green signal; scale bar, 50 μm). B, ThioS plaque-adjacent TUNEL+ cells were manually counted from CC (left) or HC (right). Bars represent the mean ± SEM of each transgenic cohort (n = 5 rats/group). C, Photomicrographs of TgF344-AD rat brain sections stained with total caspase-3 antibody and ThioS are shown (scale bar, 50 μm). D, Left, WBs for brain holo- (35 kDa band) and active (cleaved; 17 kDa band) caspase-3 are shown. Right, Densitometry is shown for ratio of active to total caspase-3 in TgF344-AD relative to WT rats. Percentage increases are indicated between age groups. Bars represent mean ratios ±SEM for each genotype (aged 6 months, n = 5; 16 months, n = 7; 26 months n = 8). E, Transmission EM reveals a Hirano body in the HC of a 16-month-old TgF344-AD rat, surrounded by dystrophic neurites (DN). The inset shows a higher magnification of the crystal lattice structure, and the scale bar denotes 500 nm. F, Photomicrographs are shown of CC and HC from a 16-month-old WT or TgF344-AD rat reacted with Phalloidin, Tuj1 antibody, 4G8 antibody, and DAPI. The arrows indicate Phalloidin-Tuj1 double positive Hirano body-like structures, and the scale bar denotes 50 μm.