
Figure 7.
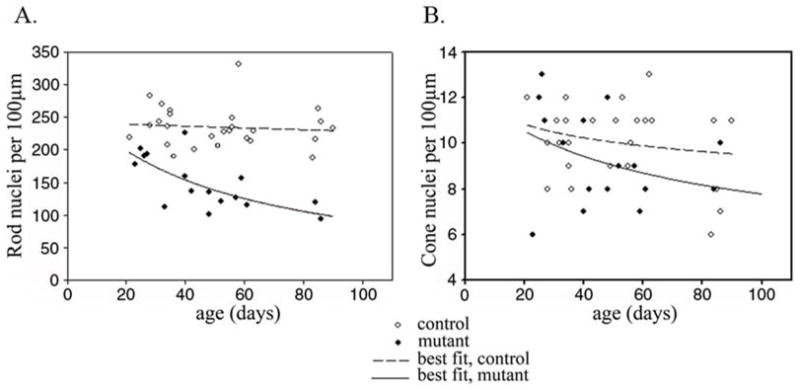
The number of rod and cone nuclei with age per unit length of retina. A. A scatter plot of number of rod and B. Cone nuclei per 100μm length of retina (central retina – region 4 – see Figure 1) plotted against age. Filled symbols represent mutant dogs and hollow symbols controls. A line of best fit to the data was calculated.