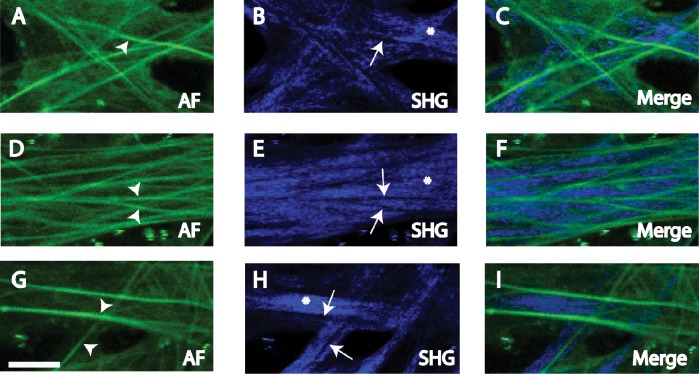
Figure 6. .
AF (A, D, G) and SHG (B, E, H) in CS not exposed to eosin due to partial overlap of eosin and AF emission spectra. AF-high (arrowheads) coincided with SHG signal voids (arrows), and AF-low coincided with SHG signals (asterisk). Merged images (C, F, I) depict the nonoverlap of AF-high and SHG signals. Scale bars: 10 μm.

