
Figure 8. .
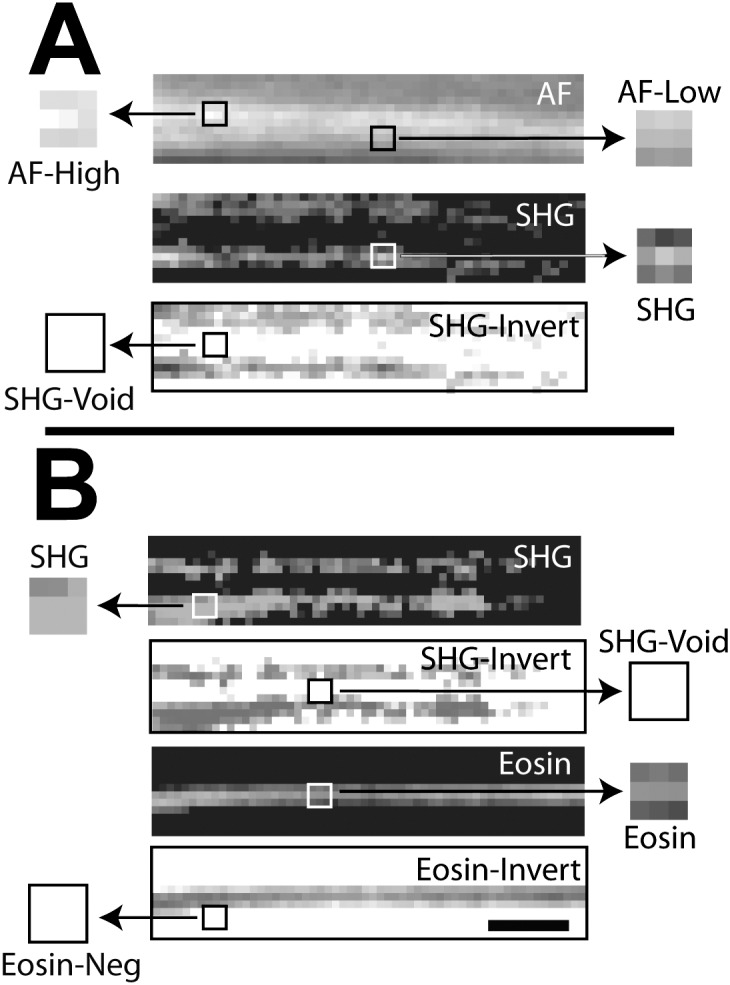
Manders colocalization analysis for autofluorescence (AF) and eosin-labeled fluorescence (Eosin) with second harmonic generation (SHG) in human uveal meshwork. Inverted images (negatives) of eosin (eosin-invert) and SHG (SHG-invert) were generated. Colocalization (Manders coefficient = 1, see Table 1) was seen between regions with (A) high intensity AF (AF-high) and SHG signal voids* (SHG-void), and lower intensity AF (AF-low) and SHG signal (SHG); (B) positive eosin-labeled fluorescence (Eosin) and SHG-Void,* and Eos-neg* and positive SHG signal (SHG). Asterisk: analysis based on inverted images. Scale bars: 2.5 μm.