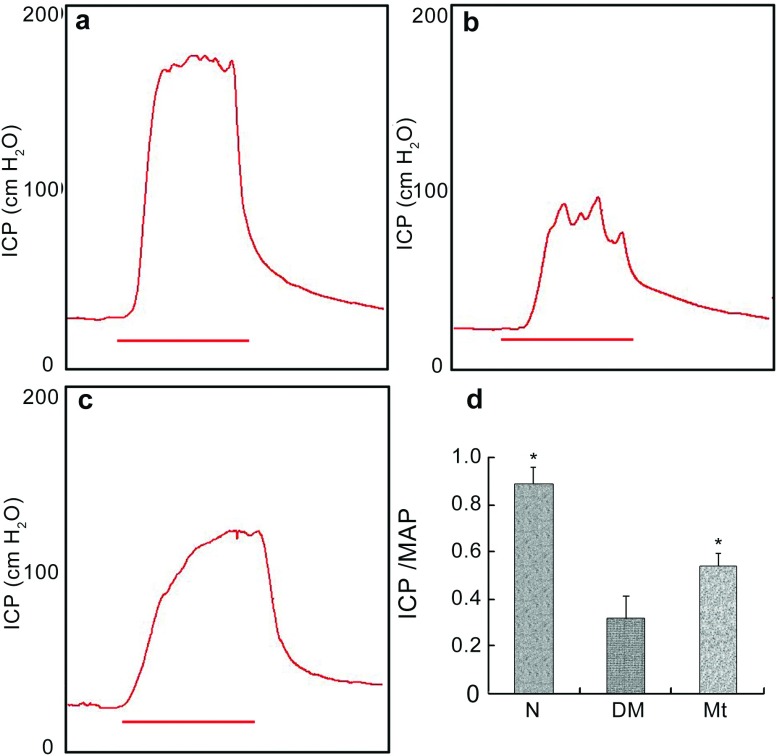
Figure 2.
Erectile function evaluation. (a–c) Representative images of intracavernous pressure (ICP) responding to stimulation of the cavernous nerve of each experimental group: (a) normal group; (b) diabetic group; (c) melatonin treatment group. Red bars represent 60-s electronic stimulation. (d) Results of erectile function expressed as the ratio between ICP and mean arterial pressure (MAP). *P<0.05 compared with the diabetic group. DM, diabetic group; Mt, melatonin treatment group, N, normal group.

