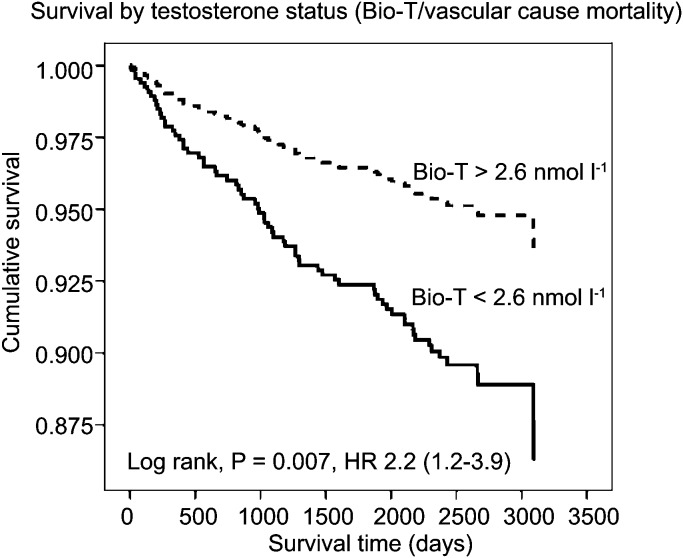
Figure 2.
A survival curve of vascular mortality based on baseline Bio-T. The solid line represents patients with baseline Bio-T less than 2.6 nmol l−1, the broken line represents patients with Bio-T greater than 2.6 nmol l−1. Reproduced from Malkin et al. (2010).42 Bio-T, bioavailable testosterone; HR, hazard ratio.

