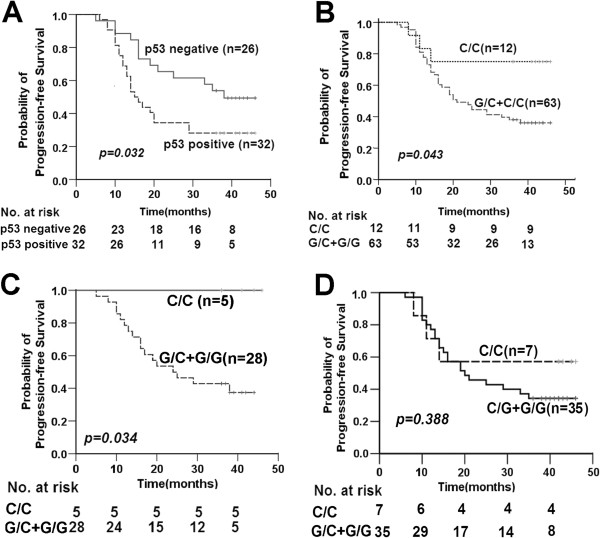
Figure 4.
Kaplan-Meier PFS curves according to P53. Kaplan-Meier PFS curves according to protein expression of p53 (positive vs. negative) among patients diagnosed as local regional lymph node metastasis (A); Kaplan-Meier PFS curves according to dominant model of p53 codon 72 SNPs (C/C vs. G/C+G/G) (B); Kaplan-Meier PFS curves according to dominant model of p53 codon 72 SNPs (C/C vs. G/C+G/G) in the pAkt-negative (C) and pAkt-positive subgroups (D). Note: p53 codon72 G is equivalent to Arg and C is equivalent to Pro.

