
Figure 1.
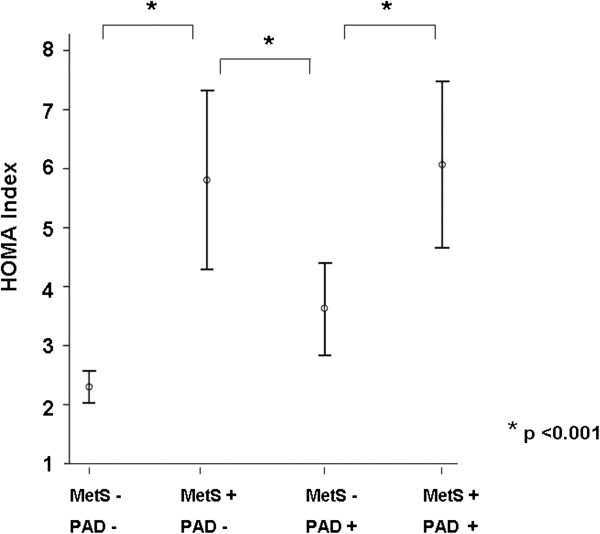
HOMA insulin resistance scores in subgroups. Graph shows mean values together with standard deviations. PAD denotes peripheral arterial disease; MetS metabolic syndrome; HOMA homeostasis model assessment.
Official websites use .gov
A
.gov website belongs to an official
government organization in the United States.
Secure .gov websites use HTTPS
A lock (
) or https:// means you've safely
connected to the .gov website. Share sensitive
information only on official, secure websites.
HOMA insulin resistance scores in subgroups. Graph shows mean values together with standard deviations. PAD denotes peripheral arterial disease; MetS metabolic syndrome; HOMA homeostasis model assessment.