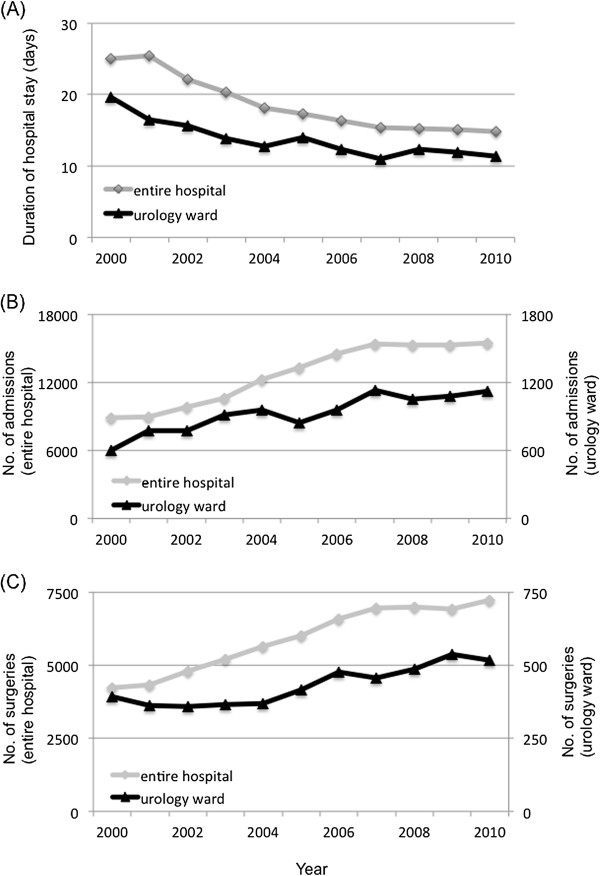
Figure 2.

The annual mean duration of hospital stay, number of admissions and number of surgeries, 2000-2010. (A) Annual mean duration of hospital stay. (B) Annual number of admissions. (C) Annual number of surgeries. For both the entire hospital and the urology ward, the mean duration of hospital stay decreased by approximately 40% (A), the annual number of hospital admissions doubled (B) and the annual number of surgeries increased by approximately 50% (C) over time.
