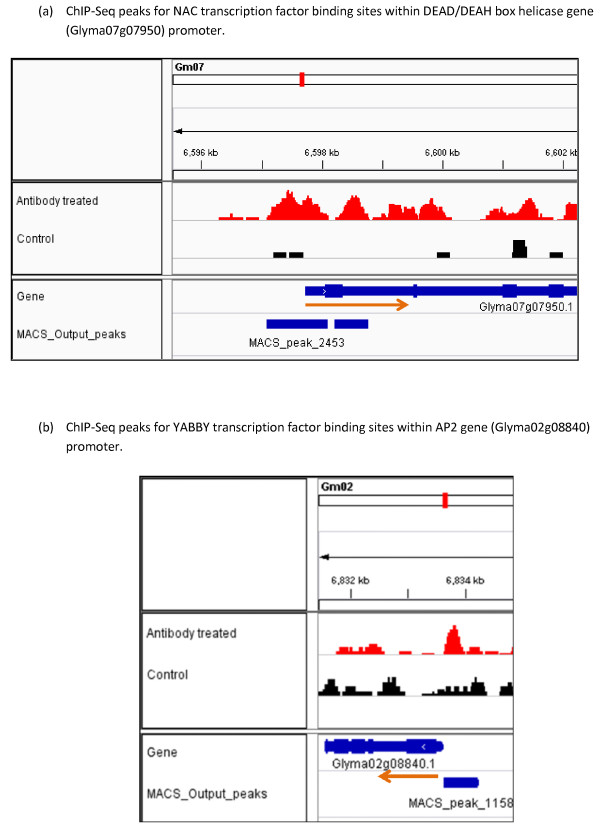
Figure 8.
Visualization of ChIP-Seq results for two representative NAC and YABBY regulated genes by Integrative Genomics Viewer (IGV). Red peaks indicate potential transcription factor binding sites in antibody treated ChIP-Seq library. Black peaks are for the control ChIP-Seq library. Genes and location of peaks are shown in blue color. The red arrow indicates the direction of transcription. (a) ChIP-Seq peaks for NAC transcription factor binding sites within DEAD/DEAH box helicase gene (Glyma07g07950) promoter. (b) ChIP-Seq peaks for YABBY transcription factor binding sites within AP2 gene (Glyma02g08840) promoter.

