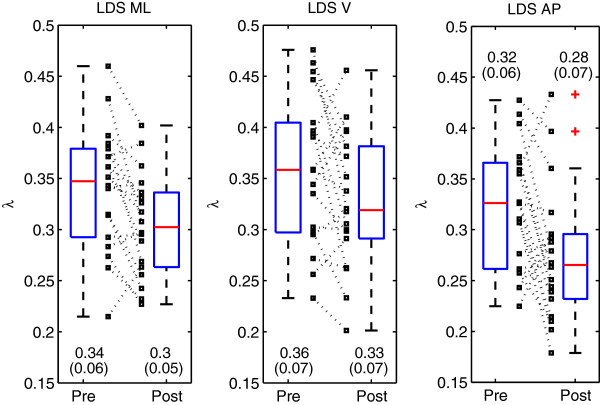
Figure 2.
Descriptive statistics of the local dynamic stability. Eighteen inpatients participated in a three week rehabilitation program. Their local dynamic stability (LDS) was evaluated at the beginning of the stay (pre) and at the end (post) with a 3D motion sensor attached to the lower back, which measured trunk acceleration in the mediolateral (ML), vertical (V) and anteroposterior (AP) direction. The spread of the individual results are presented as boxplots (median and quartiles), as well as scatter plots (small squares). Dotted lines link individual pre- and post-results. Values are mean and SD.

