
Figure 3.
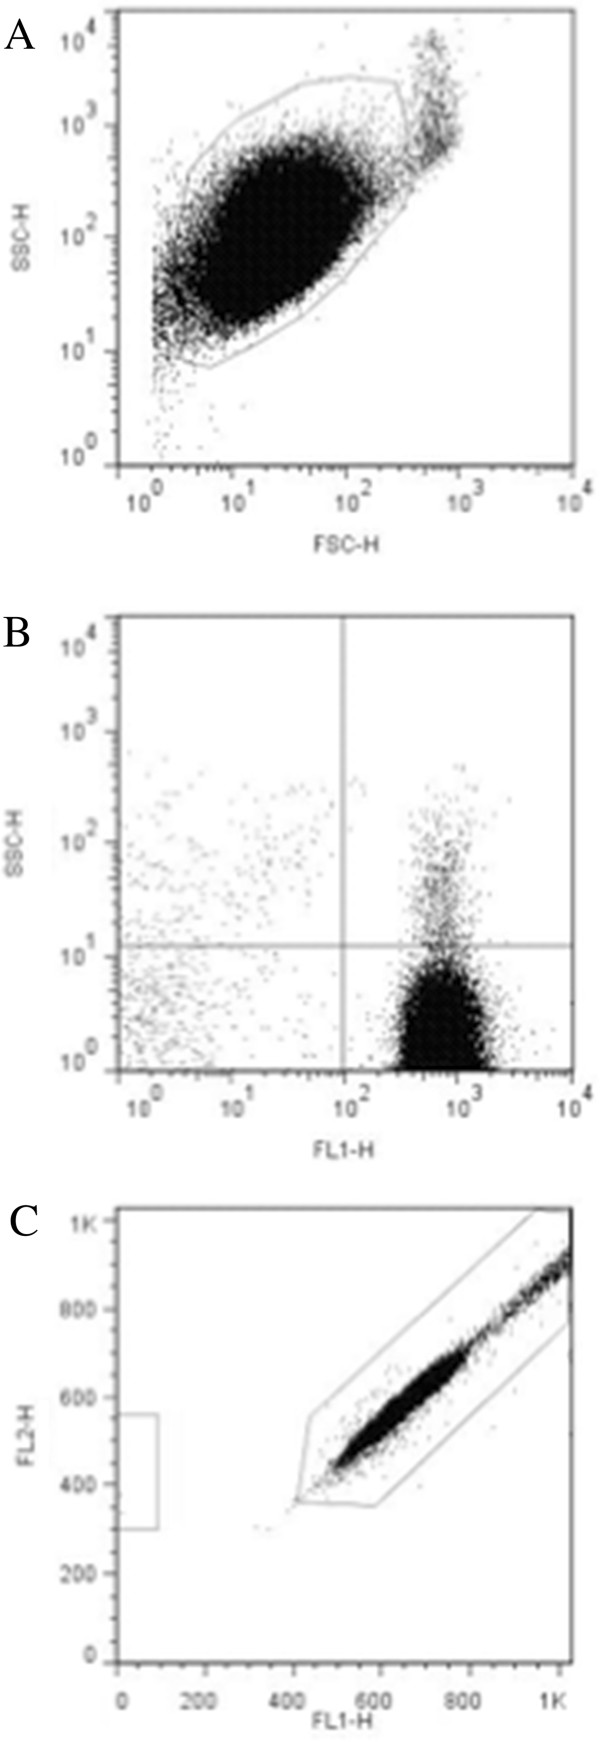
Flow cytometric analyses of optimized platelet samples after CD45-labeled Dynabead incubation. (A) Log forward and side scatter chart of platelet population (gated) of platelet sample with minimal contaminating cells. (B) Fluorescence chart of CD45 (FL2) and CD61 (FL1) antibody-labeled sample. Average CD61+: 97.99 ± 1.38% (n = 12). Average CD45+: 0.43 ± 0.33% (n = 12). (C) LeucoCOUNT chart for sample after density barrier centrifugation showing residual leukocytes (left gate) and LeucoCOUNT beads (right gate).