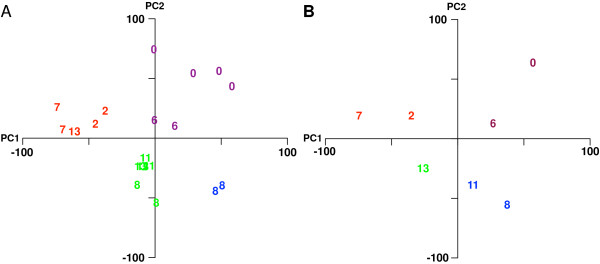
Figure 5.

PCA of the microarray results and comparison with the PCA of phytochemical data. (A) Scores plot of the PCA of four control and 14 extract treated arrays. The numbers refer to the microarrays as follows: 8, China 8; 6, USA6; 11, Europe11, 13, India13; 2, USA2, 7, USA7. PC1 and PC2 account for 29 % and 24 %, respectively, of the total variance in the data. (B) Scores plot of the PCA of the mean expression values averaged over each set of arrays (control, n = 4, China #8, n = 4, Europe #11, n = 2, India #13, n = 2, USA #2, n = 2, USA #6, n = 2). PC1 and PC2 account for 36 % and 28 %, respectively, of the total variance in the data.
