
Figure 7.
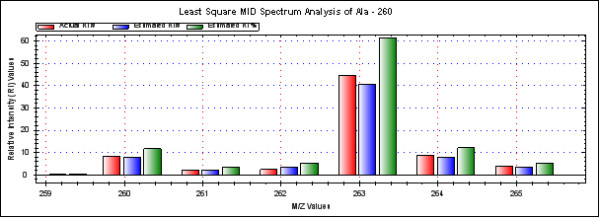
LS-MIDA; Spectrum. Alanine Mass Spectrum (Ri to m/e). Spectrum is drawn and shows estimated relative intensity values, based on the input experimental intensity values with respect to the m/e values. All data can be processed at once (click the button “Measure all the data”).