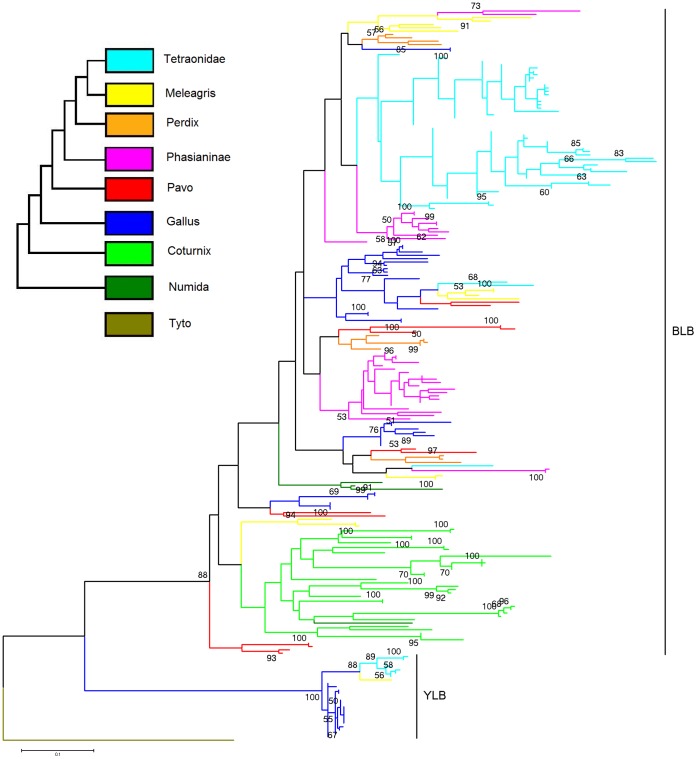
Figure 3. Maximum likelihood tree of exon 2 MHCIIB and MHCIIY sequences across galliform species.
Different colours indicate taxa, whose neutral phylogeny is shown in small inserted figure (based on [91] and [92]). The sequence of DAB1 of the barn owl (Acc. no. EF641260) was used as an outgroup. Only bootstrap values >50 are shown. For the complete list of sequences used, with GenBank accession numbers and references see File S2.

