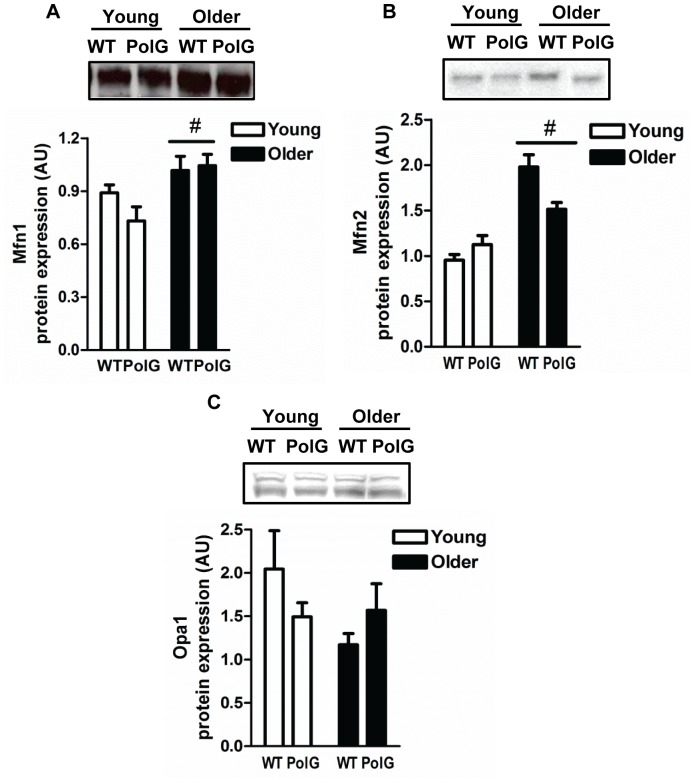
Figure 3. Altered mitochondrial fusion proteins in mtDNA mutator mice.
Immunoblotting of mitochondrial fusion proteins Mfn1 (A), Mfn2 (B) and Opa1 (C) in skeletal muscle from young (3–6 mo) and older (8–15 mo) WT and PolG animals. Representative blots are shown above with a graphical summary of the data below (n = 7–13). Two bands were detected for Opa1 representing the long and short isoforms. Both bands were quantified and total Opa1 protein content displayed in the graph. Significance was set at P<0.05 and all data are represented as mean ± SE. Data are expressed as arbitrary units (AU). #P<0.05 main effect of age.

