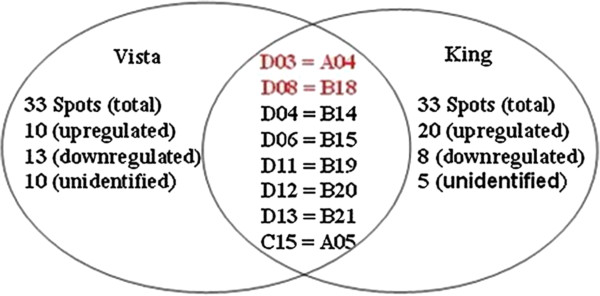
Figure 4.

Venn diagram of the differentially regulated Vista and King proteins. The numbers of differentially expressed proteins found in the cultivar proteomes are given. For differentially regulated proteins found in both proteomes, the spot numbers for Vista proteins are given on the right and the spot numbers for the corresponding King proteins are given on the left. The proteins for the spot numbers in red were not identified.
