
Figure 1. Correlated Spikes of Retinal GCs Occur on Varied Timescales.
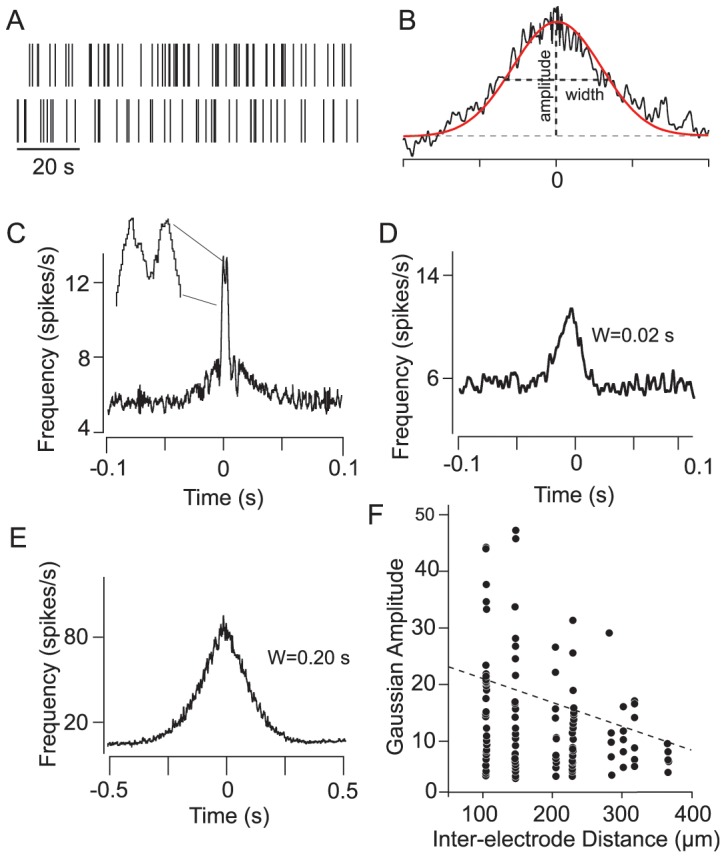
(A) Panel shows exemplary spontaneous spikes of a GC pair recorded simultaneously. (B) Cross-correlation functions (CCFs) of spontaneous spikes were fit with a Gaussian function from which values for amplitude and width were computed. (C) CCF with a bimodal structure consisting of two peaks separated by a central trough at time zero (inset). Note that the narrow bimodal component is superimposed on a somewhat broader profile. (D and E) CCFs displaying unimodal peaks with different Gaussian widths (W), reflecting differences in the temporal precision of unimodal spike correlations. (F) Scatterplot demonstrating an inverse relationship between the Gaussian amplitudes for unimodal CCFs and the inter-somatic distance of the recorded GC pairs. The dashed line indicates a linear regression fit of the data.