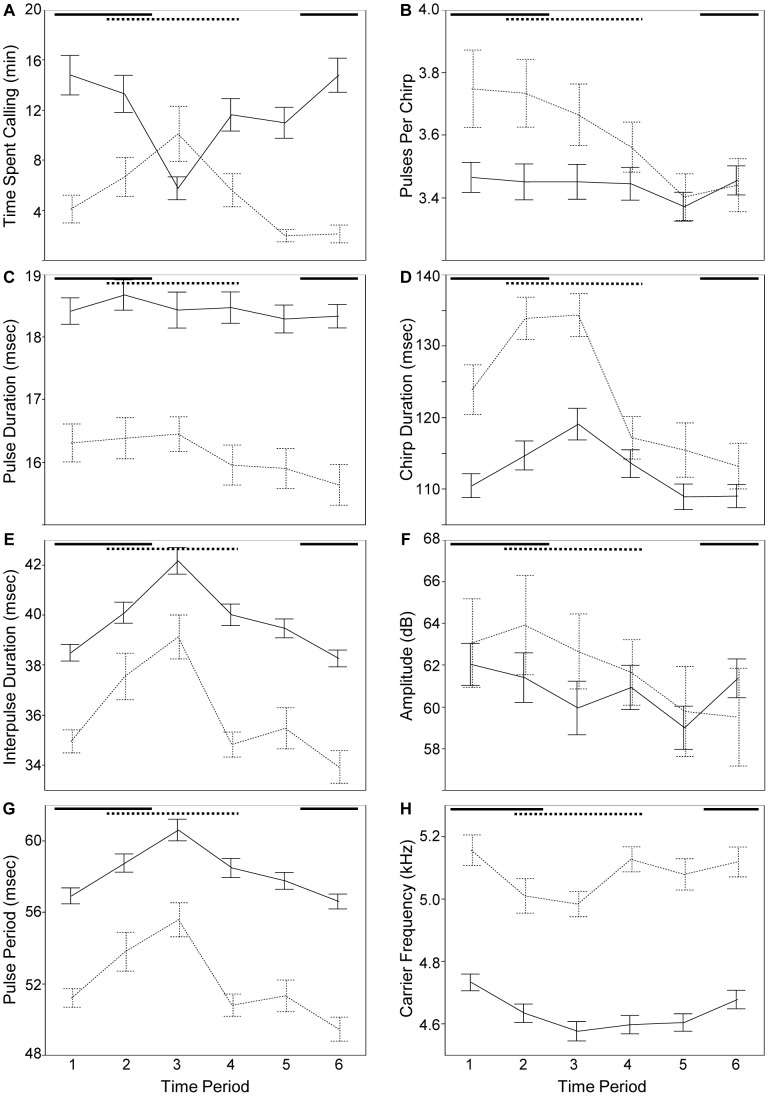
Figure 2. Signaling diel rhythms in G. pennsylvanicus (solid lines) and G. veletis (dotted lines).
Error bars are standard error of the mean. Horizontal lines at the top of each panel depict the time of day that mating activity is highest (from [32]). Time periods: 1 = 00∶00–03∶59; 2 = 04∶00–07∶59; 3 = 08∶00–11∶59; 4 = 12∶00–15∶59; 5 = 16∶00–19∶59; 6 = 20∶00–23∶59.

