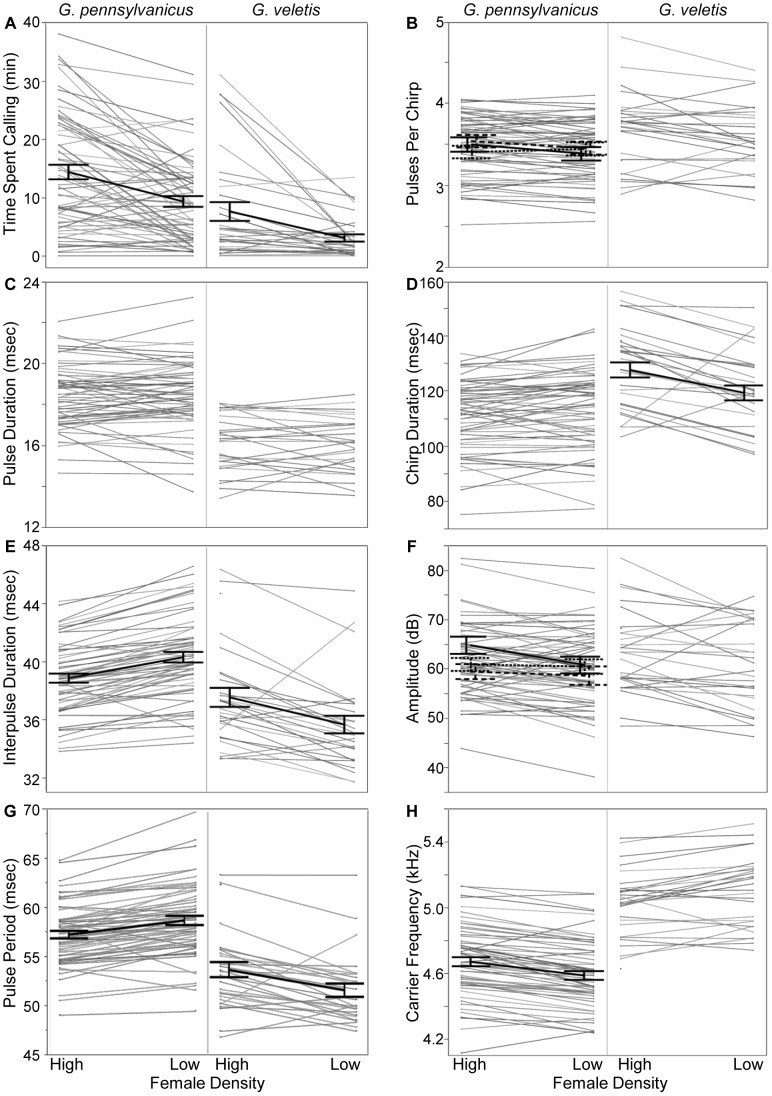
Figure 3. Signaling plasticity across times of high and low mating activity in nature.
Mating activity in nature: G. pennsylvanicus high = 22∶00–09∶59, low = 10∶00–21∶59; G. veletis high = 04∶00–15∶59, low = 16∶00–03∶59 ([32]). Each thin gray line represents an individual. Significant time period effects are shown using heavy black lines; significant interactions between mating activity and size are shown with three lines (solid - large, dotted - medium, dashed - small); statistics are shown in Tables 2–4.

