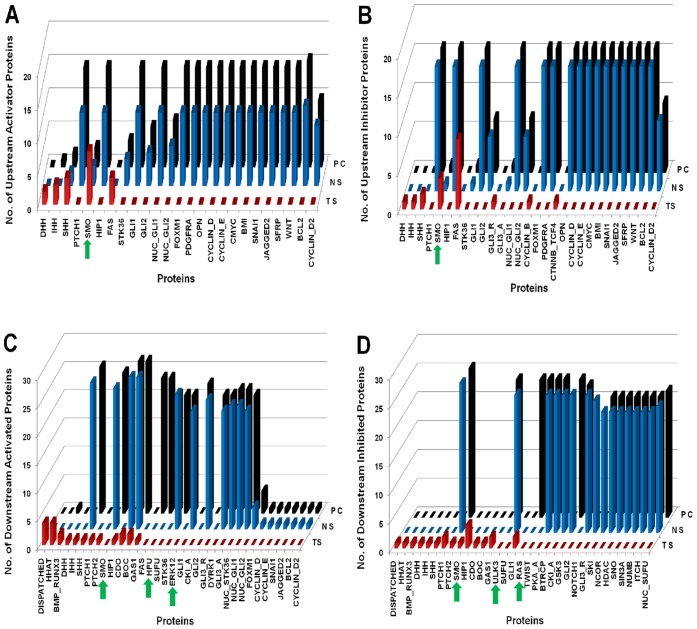
Figure 6. Comparison between Normal, Cancer and Perturbed scenarios for Pancreatic Cancer.
TS: Treated Scenario; NS: Normal Scenario; PC: Pancreatic Cancer Scenario. The green arrow heads are indicating the minimal combination of proteins which was inhibited in the drug treated perturbation analysis. (A) Represents number of Upstream activator proteins (Y-axis) activating the proteins (X-axis) representing significant variations. Compared to the normal scenario, proteins, SHH, IHH, SMO, GLI1, GLI2 and output proteins BMI, SNAI1, BCL2 and Cyclins are activated by maximum number of upstream activator proteins. On drug treated perturbation of SMO, HFU, ULK3, RAS and ERK12, the number of activators of the output proteins become zero. (B) Represents number of upstream inhibitory proteins (Y-axis) inhibiting the proteins (X-axis) representing significant variations. The numbers of upstream inhibitor proteins in normal versus Pancreatic cancer scenario remain same. Similar perturbation results are observed as in (A). (C) Represents number of downstream proteins (Y-axis) activated by the proteins (X-axis) representing significant variations. The numbers of downstream proteins activated in normal versus Pancreatic Cancer remain same. On perturbation of SMO, HFU, ULK3, RAS and ERK12, the number of downstream proteins activated by these proteins is reduced to zero. (D) Represents number of downstream proteins (Y-axis) inhibited by the proteins (X-axis) representing significant variations. The numbers of downstream proteins inhibited in normal versus Pancreatic cancer scenario remain same.

