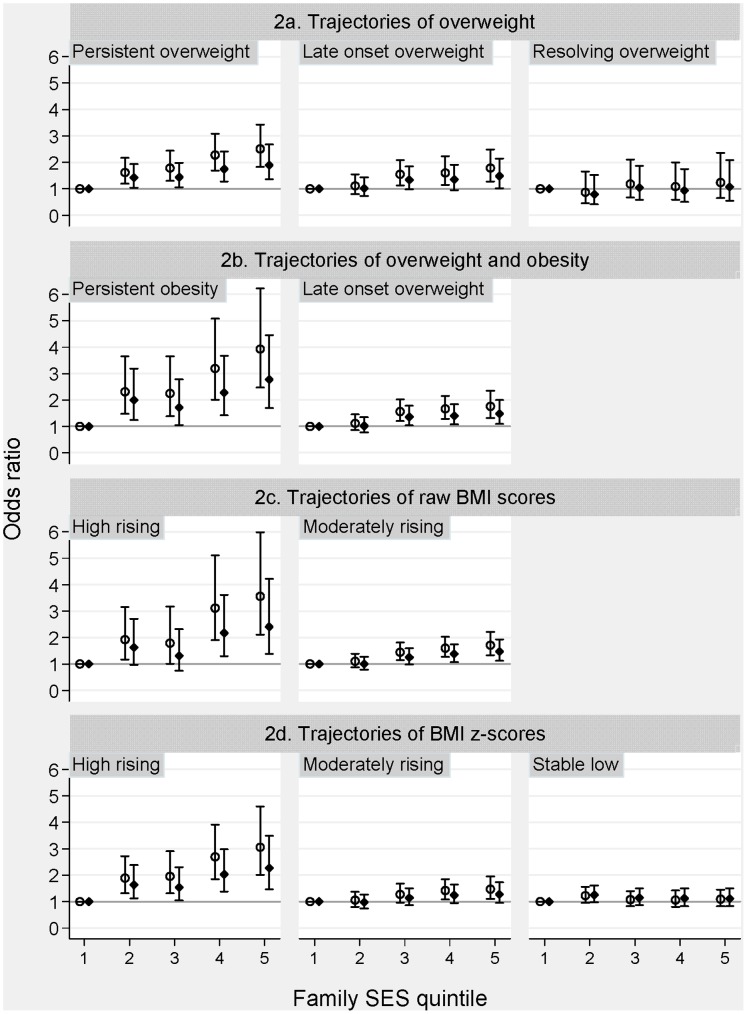
Figure 2. Association between family socioeconomic status and weight trajectories from age 4–5 to age 10–11 years based on different BMI classifications.
Footnotes Figure 2. Hollow-Circles (○) represent ORs adjusted for confounders (Indigenous status and non-English speaking background) and diamond symbols (♦) represent ORs additionally adjusted for birth weight and parental BMI. Bars represent 95% CI.

