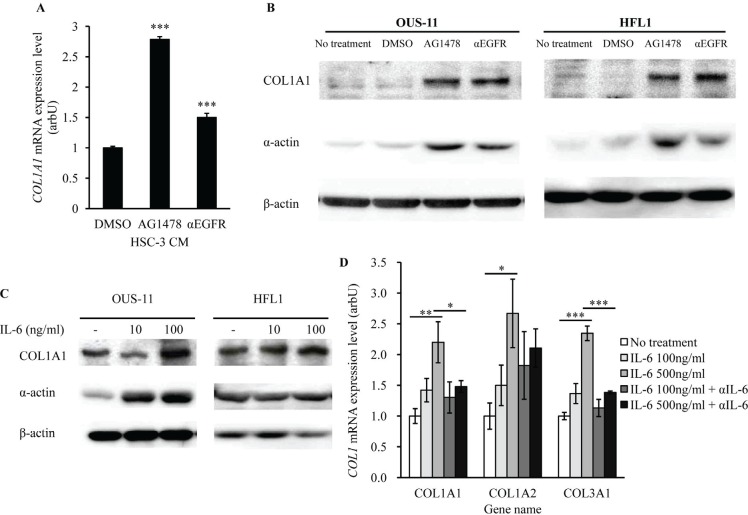
Figure 5. EGFR-TKI and IL-6 increase the expression of fibrosis markers.
(A) OUS-3 cells were cultured with CM obtained from AG1478- or αEGFR antibody -treated HSC-3 cells for 72 hrs. Then, COL1A1 mRNA expression was measured using qPCR. GAPDH was used as the internal control. Bars represent average ± SD of three independent experiments. ***P < 0.001 by student's t test (vs DMSO). arbU; arbitrary units. (B) OUS-11 and HFL1 cells were co-cultured with AG1478- or αEGFR antibody -treated HSC-3 cells for 7 days. Then, COL1A1 (210 kDa) and α-actin (42 kDa) proteins were assayed using western blotting. β-Actin was used as internal control. (C) OUS-11 and HFL1 cells treated with IL-6 were analyzed on western blotting, using antibodies to COL1A1 and α-actin. β-Actin was used as internal control. (D) OUS-11 cells treated with IL-6 and/or αIL-6 antibody for 72 hrs were assayed for qPCR to determine mRNA levels of COL1A1, COL1A2, and COL1A3. GAPDH was used as the internal control. Bars represent average ± SD of three independent experiments. *P < 0.01, **P < 0.01, and ***P < 0.001 by student's t test. arbU; arbitrary units.

