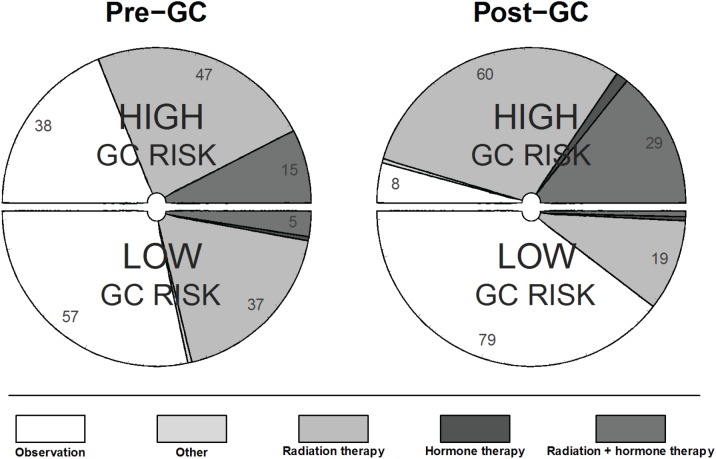
Figure 1. Breakdown of treatment recommendations pre-GC and post-GC for low and high GC risk groups in the adjuvant setting.
Pre-GC treatment recommendations shown on left, post-GC treatment recommendation shown on right. Numbers indicate the % of patient cases for which a specific treatment recommendation was made in the respective GC group (100% for each GC risk group).

