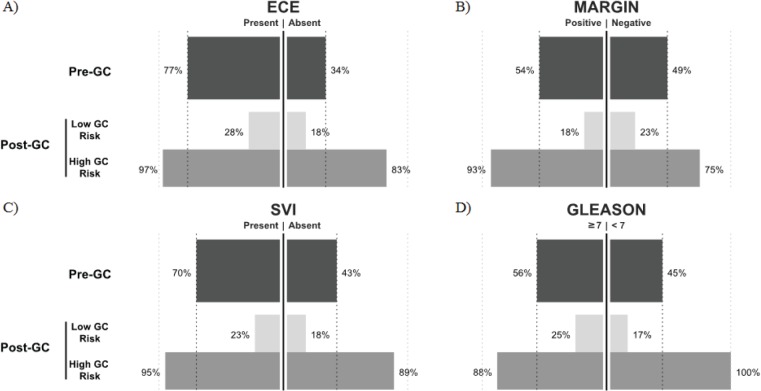
Figure 2. Proportion of recommendations for treatment for the indicated values of clinical variables (e.g. Presence/Absence) Pre-GC and the resulting proportion recommended for treatment post-GC in high and low GC risk groups in the adjuvant setting.
A) Extracapsular Extension (ECE), B) Surgical Margins, C) Seminal Vesicle Invasion (SVI) and D) Gleason score. Proportions of patients recommended treatment indicated on x-axis (%) depending on clinical variable status for pre-GC (dark grey, top), low GC risk (lightest grey, middle) and high GC risk (light grey, bottom). High GC tends to result in treatment rates higher than pre-GC while low GC tends to result in treatment rates lower than pre-GC.

