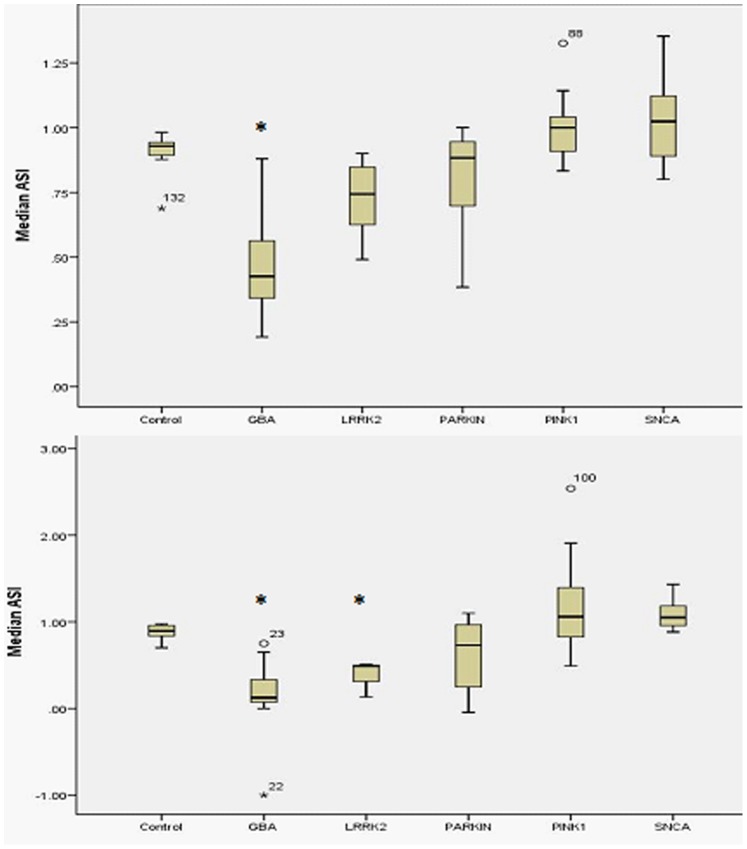
Figure 1. Caudate and putament asymmetry index for subtypes of genetic Parkinson's disease.
1a. Boxplot of caudate asymmetry index for each genotype. Median caudate asymmetry is signficantly different for GBA compared to control. 1b. Boxplot of putamen asymmetry index for each genotype. Median putamen asymmetry is significantly different for GBA and LRRK2 groups compared to control.

