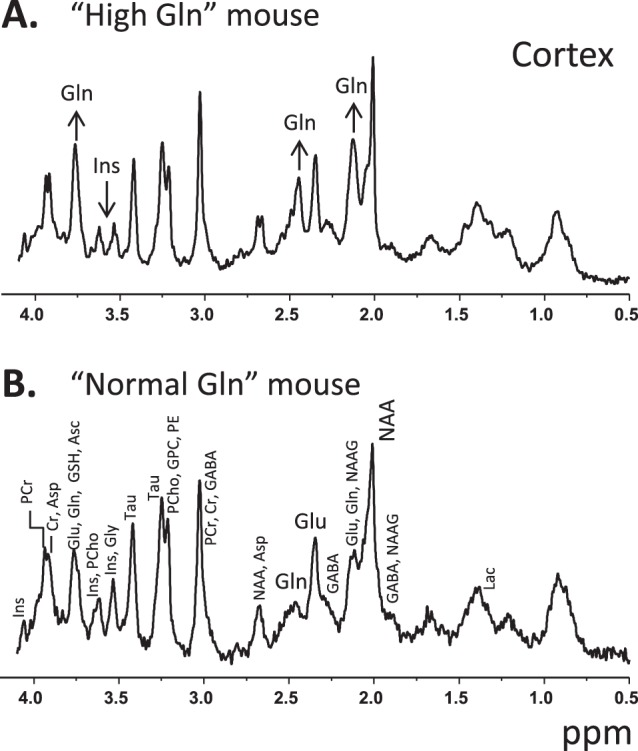
Figure 1. Representative in vivo spectra acquired at 14.1T in the cortex (VOI = 0.8×4×1.2 mm3) of “High Gln” (A) and “Normal Gln” (B) C57BL/6J mice.

The increase of Gln and decrease of Ins in the cortex of the “High Gln” mouse is visually apparent. Only those metabolites displaying a concentration change are labeled (i.e. Gln and Ins) for the “High Gln” spectrum.
